Stop scrolling. In a world drowning in text, your audience’s eyes crave clarity, color, and connection in seconds. That’s your infographic advantage. This isn’t about making data “pretty”—it’s about making your message unignorable. Infographics are your secret weapon to slash bounce rates, spike social shares, and command attention in search results.
Think about it: visuals are processed 60,000x faster than text. By transforming dense reports, complex processes, or dry stats into a captivating visual flow, you’re not just simplifying information—you’re engineering an experience. This superior user experience tells Google your page is valuable, boosting your SEO with longer visits and loyal engagement. Plus, a brilliantly useful infographic becomes a linkable asset, earning authoritative backlinks that propel your domain authority.
Ready to turn viewers into visitors and data into devotion? This guide is your blueprint. We’ll crack the code on choosing the perfect infographic type—whether it’s a hard-hitting statistical visual or an irresistible process flow. You’ll learn design secrets for instant clarity, a killer promotion playbook to leverage influencers and social algorithms, and the exact metrics to track for unstoppable growth. Let’s build visuals that don’t just get seen—they get saved, shared, and searched for.
Key Takeaways
- Infographics boost your engagement because they are visually appealing and present data simply.
- You should create attractive infographics that make hard information easy to understand. This method makes your content more shareable and interesting to your audience.
- To improve search engine visibility, use relevant keywords and descriptions in your infographics. Share these visuals on social media to reach more people and encourage them to share, which enhances engagement.
- Work with influencers and bloggers to use their networks. This plan helps drive traffic to your content through focused sharing.
- Keep an eye on performance metrics like shares and rates. Use this information to improve your infographic strategy and increase overall engagement.
Importance of Infographics
Infographics are very important for getting attention in our quick digital world.
People understand images quicker than text, which makes infographics a strong way to connect with people.
They make complicated data easier to understand, helping users see the main ideas fast.
Adding keywords and optimizing alt text in infographics helps them show up better in search results.
Using infographics in content plans improves how people experience your content.
It also helps to show that you know a lot about your topic.
Adding infographics boosts your online presence and they’re vital for content marketing in Dublin.
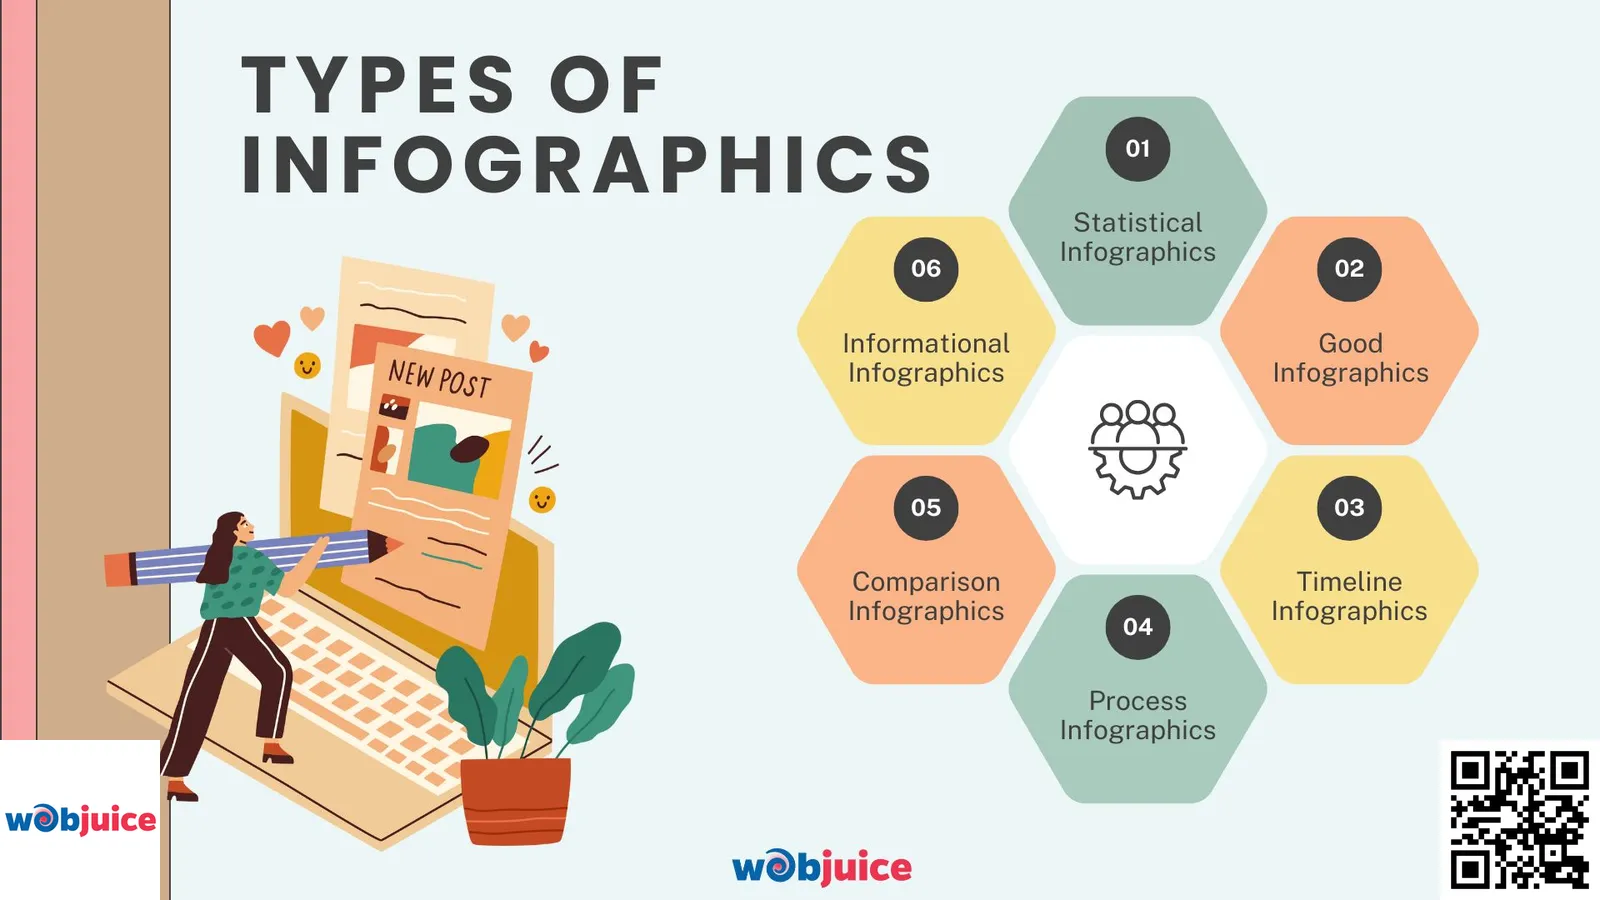
Types of Infographics
These are the types of infographics:
- Statistical infographics visually show data. They make hard stats easier to understand. You can use them to share research results or survey data.
- Good infographics are important for on-page SEO. They can help keep users interested and make them stay longer on your website.
- Timeline infographics show events in order. They are great for telling a story or following steps over time.
- Process infographics simplify steps in a process. They help your audience with detailed tasks.
- Comparison infographics show two or more items side by side. They help people make better choices.
- Informational infographics mix text and images to explain ideas or concepts. They can be used for many different subjects.
Choose the best type of infographic to improve your content’s engagement.
Designing Effective Infographics
Begin with a simple layout. Help viewers move through your content smoothly.
Mix images and text in a good way.
Use bright colours that match your brand.
Make the viewers feel the right emotions.
Create content that looks good and gives information.
This will help to attract and keep viewers’ attention.
Promoting Your Infographics
Share your infographic on your website and use important keywords.
This helps it show up in search results.
Use alt text for images and clear file names to improve your SEO plan.
Next, use social media.
Share your graphic on Facebook, Twitter, LinkedIn, and Instagram to reach different audiences.
Ask your followers to share it too, so more people can see it.
Join online groups and forums that fit your interests.
Share your infographic with people who think like you.
Contact bloggers and influencers who work in your area.
An engaging blog post or teamwork can bring more people to your site.
Submit to content-sharing sites like Pinterest and SlideShare to reach more people.
Measuring Success and Engagement
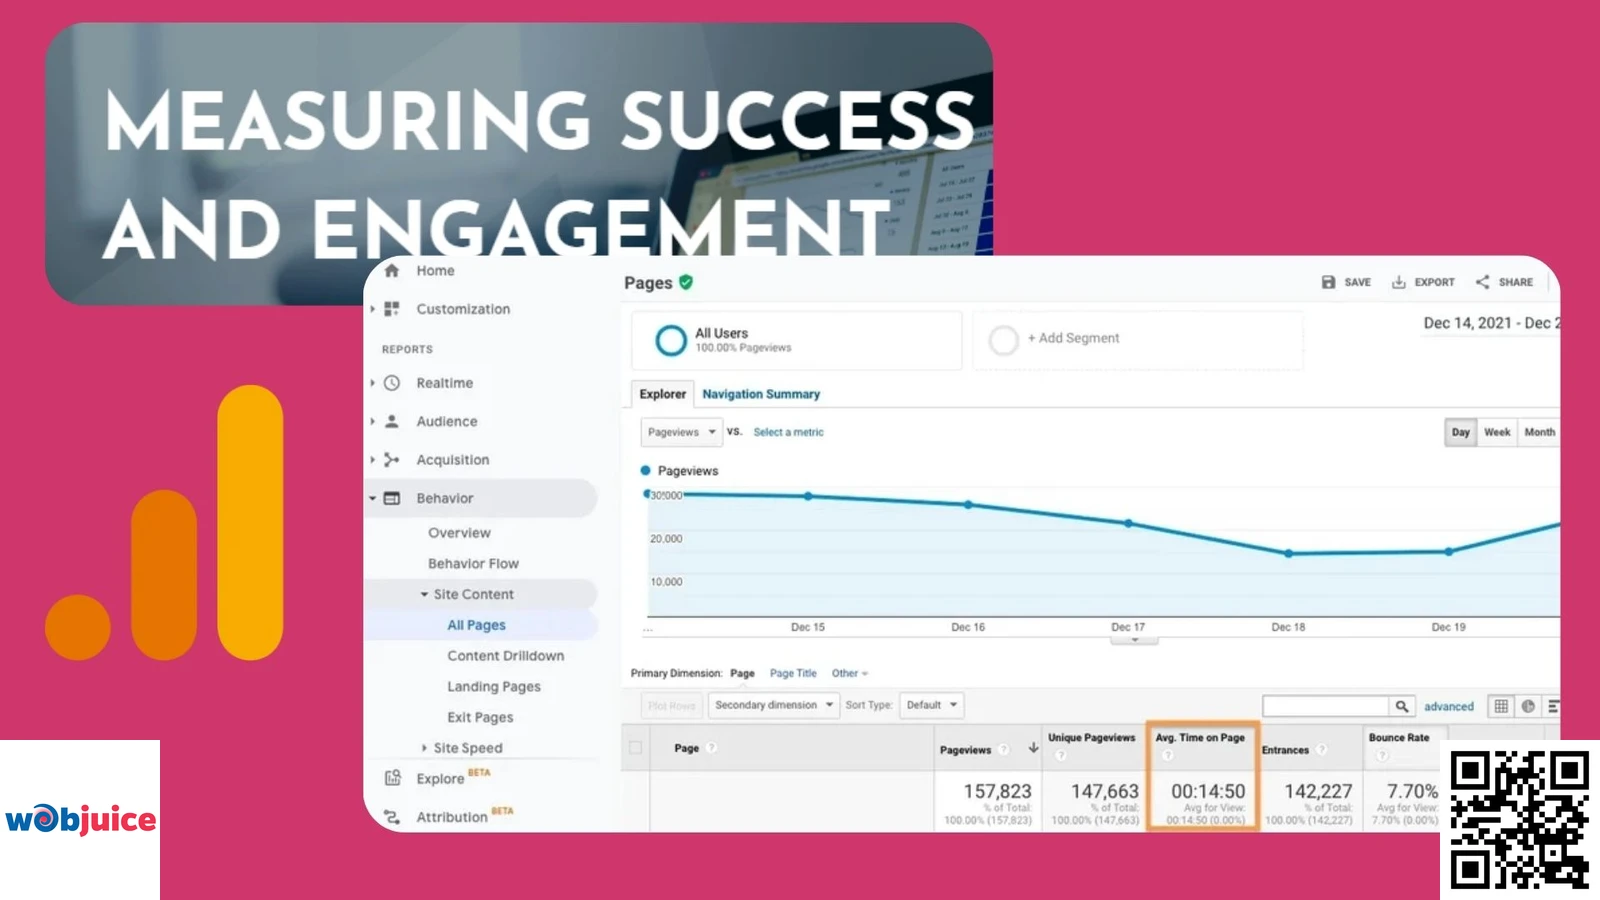
Start by looking at page views, shares, and time spent on the page.
These signs show how much your audience connects with the content.
Google Analytics can help you keep track of these numbers.
Next, check engagement metrics such as comments and social media interactions.
High engagement shows that your infographic gets people talking.
Ask viewers to share what they think.
Don’t ignore conversion rates.
If you want to get leads or sales, check how many people take action after they see your infographic.
Infographic Marketing & SEO FAQs
How do infographics specifically improve my website’s SEO?
Infographics enhance SEO performance through multiple, powerful mechanisms that signal value to search engines like Google. Primarily, they dramatically improve user engagement metrics, which are critical ranking factors. A compelling infographic increases dwell time (visitor duration on page) by 50-80% on average and reduces bounce rates, as users engage deeply with visual content rather than immediately exiting.
Secondly, high-quality infographics function as exceptional linkable assets. When authoritative websites and industry blogs embed or link to your infographic as a reference resource, you earn valuable editorial backlinks. These backlinks directly boost your domain authority and search visibility for competitive keywords. Research shows infographics are shared 3x more than other content types, multiplying this link-earning potential.
seo-trends-2024-visual-guide.png), comprehensive alt text descriptions for accessibility and SEO, and surround it with 300-500 words of relevant, keyword-optimized text to provide full context for search engine crawlers.What is the most effective type of infographic for generating leads?
For direct lead generation and sales conversion, two infographic formats dominate:
- Comparison Infographics: These work exceptionally well in the decision stage of the buyer’s journey. Visual side-by-side comparisons (e.g., “Product A vs. Competitor B” or “Service Package Comparisons”) help overcome objections and highlight your unique value proposition. They reduce cognitive load for prospects, making complex decisions easier and faster.
- Statistical/Data-Driven Infographics: Original research, industry benchmarks, or survey results presented visually establish immediate thought leadership and credibility. These can be effectively used as gated content—offering the full infographic in exchange for contact information—creating a high-value lead magnet that attracts qualified prospects.
Both formats should include strategic calls-to-action (CTAs) integrated into the design flow, such as:
- “Download the complete data set” (lead capture)
- “Get your personalized analysis” (sales qualification)
- “Book a consultation to implement this” (direct conversion)
Place these CTAs both within the infographic design itself and in the accompanying webpage content to maximize conversion pathways.
Where should I promote my infographic for maximum reach?
A multi-channel promotion strategy across four key areas delivers optimal results:
1. Owned Media Foundation: Begin by publishing an optimized blog post featuring the infographic on your website. Share it via your email newsletter segments and add it to a permanent “Visual Resources” or “Guides” section of your site for evergreen traffic.
2. Social & Visual Platforms: Tailor your approach per platform:
- LinkedIn: Ideal for B2B. Share in relevant groups and use carousel posts for multi-section infographics.
- Pinterest: Create multiple pin designs with keyword-rich descriptions. Infographics get 3x more shares on Pinterest than standard images.
- Instagram: Use the carousel format or create short video teasers using the infographic’s key points.
3. Strategic Outreach: For backlink acquisition, identify 30-50 industry bloggers, journalists, and influencers whose audience would benefit. Send personalized emails offering your infographic as a free, embeddable resource with pre-written HTML embed code to simplify their process.
4. Community Engagement: Share in relevant niche communities like specific subreddits, Facebook Groups, or industry forums where it provides genuine educational value. Always follow community guidelines and focus on contribution rather than promotion.
What are the ideal length and design rules for infographics?
The optimal infographic length balances comprehensive coverage with scroll-depth completion rates. Industry data suggests:
- Standard/Long-form: 1,500-8,000 pixels tall (the most common and effective range)
- Short-form/Social: 800-1,200 pixels (optimized for specific platform dimensions)
- Ultra-long/Comprehensive: Up to 15,000 pixels for detailed guides or reports
Critical Design Rules for SEO & Readability:
- Mobile-First Design: Over 60% of content is consumed on mobile. Ensure text remains legible without zooming (minimum 16px font for body text) and the layout maintains proper hierarchy on smaller screens.
- Visual Hierarchy System: Use size, color intensity, and spatial positioning to guide the viewer’s eye logically from headline through supporting points to conclusion. Establish clear visual “chunks” of information.
- Brand Consistency: Maintain your brand’s color palette (limit to 3-4 primary colors) and typography (maximum two complementary fonts). Include discreet but visible branding (logo/URL) to ensure attribution when shared.
- Accessibility Standards: Ensure sufficient color contrast (4.5:1 ratio for normal text), include descriptive alt text for all visual elements, and structure information so it remains comprehensible if viewed without color.
- Data Credibility: Always cite sources with clickable links or clear references. This builds trust with both users and websites considering linking to your content.
What metrics truly measure infographic success?
Move beyond vanity metrics and track this comprehensive dashboard across four categories:
1. Engagement & Consumption Metrics:
- Average Time on Page: The single most important engagement metric. Compare against your site average.
- Scroll Depth (via Google Analytics): What percentage of users reach 25%, 50%, 75%, and 100% of your infographic?
- Social Shares & Comments: Track per platform to identify where your content resonates most.
2. SEO & Visibility Metrics:
- Organic Search Traffic: Monitor increases to the infographic page over 30-90 days.
- New Referring Domains: Use tools like Ahrefs or Semrush to track authoritative websites linking to your infographic.
- Keyword Rankings: Track improvements for target keywords associated with the infographic topic.
3. Conversion & Business Metrics:
- Lead Generation Rate: Form submissions or downloads directly attributed to the infographic.
- Assisted Conversions: How often does the infographic appear in conversion paths before the final touchpoint?
- Content ROI: Calculate (Revenue from infographic leads – Production/Promotion costs) / Costs.
4. Asset-Specific Metrics:
- Embed Count: Track how many websites display your infographic using reverse image search or embed tracking codes.
- Download Requests: If offered as a gated asset, track request volume and quality.
Conclusion: Lock In Your Visual Marketing Victory
Don’t let your masterpiece gather digital dust. An infographic is a growth engine, and to ignite it, you need a strategic launch and relentless optimization.
First, marry stunning design with smart SEO. Before your first sketch, plant keyword seeds in your concept. Optimize every element: the file name, the title, the surrounding text, and the crucial alt text. This makes your visual a magnet for search traffic.
Next, promote with precision and partnerships. Launch across your social channels with tailored captions. Then, go hunting—identify forums, communities, and influencers who need your visual. A personalized outreach offering your infographic as a resource can secure high-value shares and links that pure advertising can’t buy.
Finally, measure what matters to multiply success. Analytics are your compass. Track beyond vanity metrics. How long do people engage? What’s the share rate? Is it driving leads or conversions? This data is gold—use it to refine your topics, sharpen your designs, and double down on the promotion channels that deliver real results.
Commit to this cycle: Create. Optimize. Promote. Analyze. Repeat. When you do, you stop just posting content and start building a visual library of authority—one that drives sustainable traffic, earns trust, and consistently converts your audience.
